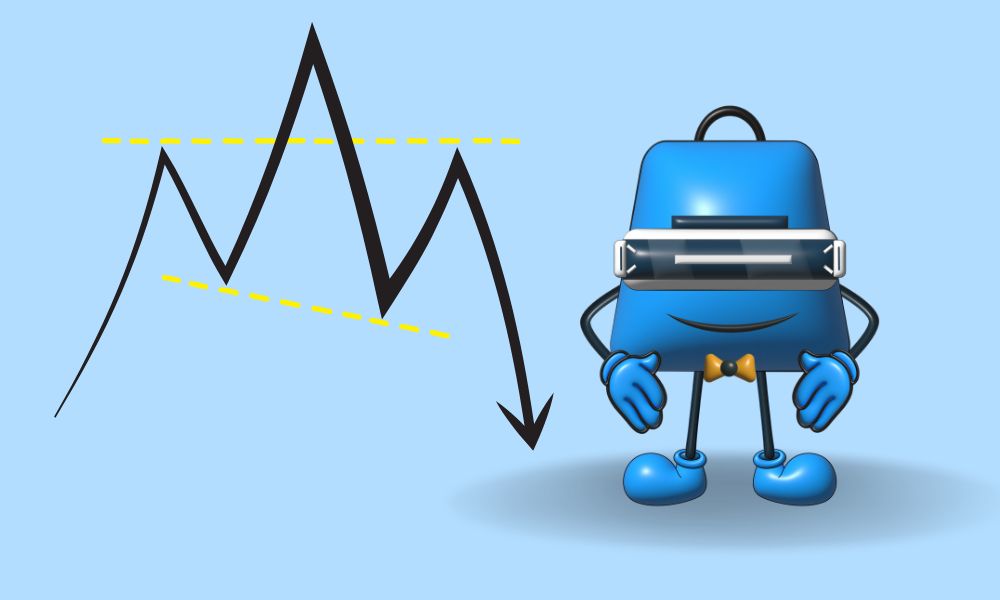
An inverse head and shoulders pattern, also known as a "head and shoulders bottom," resembles the conventional head and shoulders pattern, but is inverted: the head and shoulders top is used to forecast reversals in downtrends.
This pattern is characterized when the price action of a security exhibits the following characteristics: the price falls to a trough and then rises; the price falls below the previous trough and then rises; and finally, the price falls but does not reach the second trough.
As soon as the final dip is formed, the price rises toward the resistance found towards the top of the preceding troughs.
What Do Inverse Head and Shoulders Indicate?
Typically, investors initiate a long position when the price climbs above the neckline's resistance. The first and third troughs are shoulders, whereas the second peak is the head.
A rise above the resistance level, also known as the neckline, is interpreted as a signal for a fast upward surge.
Numerous traders await a significant increase in volume to validate the breakout. This pattern is the inverse of the well-known head and shoulders pattern and is used to forecast shifts in a downward trend.
A good profit goal is found by measuring the distance between the bottom of the head and the neckline of the pattern and using that distance to predict how far the price might move in the direction of the breakout.
For instance, if the distance between the head and neckline is ten points, the profit target is placed ten points above the neckline of the pattern.
A stop-loss order might be set aggressively below the breakout price bar or candle. Alternatively, a conservative stop-loss order might be placed below the right shoulder of the inverse head and shoulders pattern.
An inverse head-and-shoulders pattern consists of three elements:
The opposite of an inverse head and shoulders chart is a conventional head and shoulders chart, which forecasts uptrend reversals.
This pattern occurs when a security's price rises to a peak, then dips, then rises again, although not as high as the second peak. After the final high, the price continues to fall approaching the past peaks' resistance.
Disadvantages of an inverse Head and Shoulders
As with other charting patterns, the head and shoulders pattern's ups and downs convey a very precise story about the conflict between bulls and bears.
The first decline and subsequent peak show the past negative trend's momentum developing into the first shoulder segment.
Bears, desiring to prolong the downward trend for as long as possible, attempt to push the price below the initial trough after the shoulder to a new low (the head).
It is still feasible at this time for bears to regain market dominance and continue the downward trend.
But it will be clear that bulls are winning until the price rises a second time and surpasses the prior top.
Bears make another attempt to drive the stock lower, but are only successful in getting to the lower low made at the initial slump.
The bulls take control after the bears are unable to surpass the lowest low, driving the price higher to complete the reversal.